 OpenGeofiction

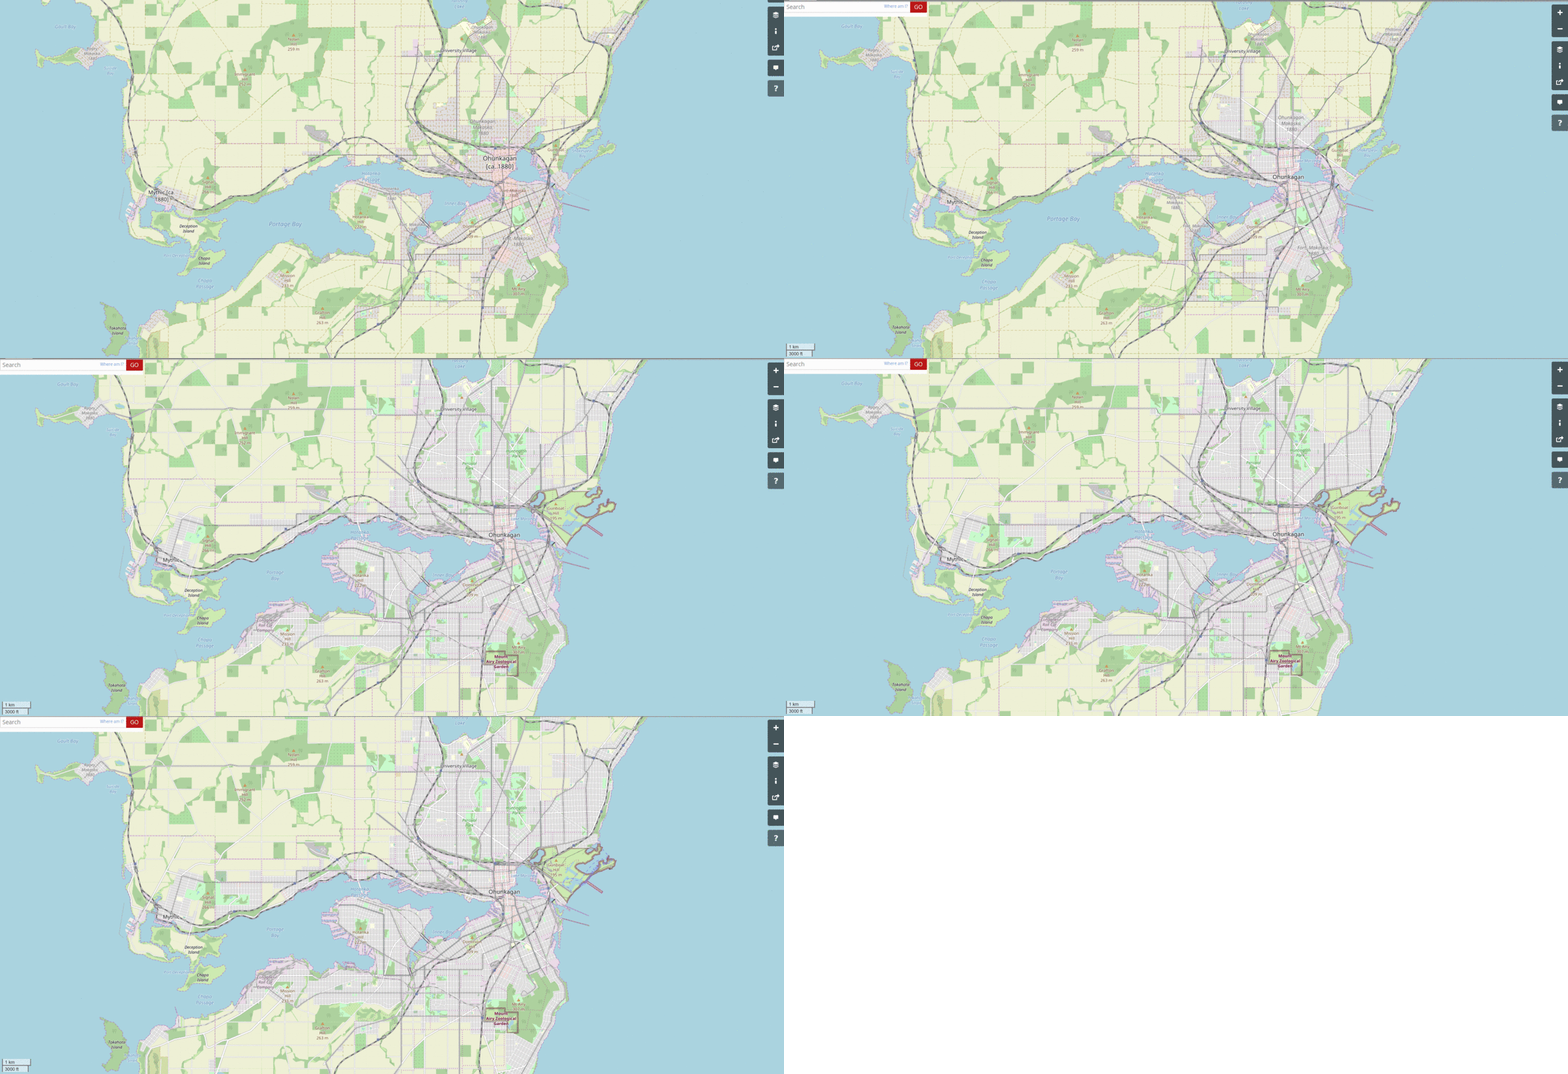
This is one of the hoped-for benefits of my historical mapping approach. I do a screenshot every now and then using the exact same window size and coordinates, and make it into a gif. This gif covers the years 1880-1896. As time passes, it will get longer and more interesting.
Leave a comment
Log in to leave a comment
Discussion
Comment from wangi on 5 July 2020 at 02:14
That’s great
Comment from Pawl on 5 July 2020 at 12:37
I love this sort of thing. I’ve done the same thing on a longer timescale (century-by-century) with Porthbrenin in Tircambry, and will do it in Wesmandy when it eventually starts moving forward from the 15th century! I save the osm file for each century and use Maperitive to generate the maps.
Comment from newflanders on 6 July 2020 at 06:09
Impressive ! I love that effect. You must be someone super organised to plan the growth of your city just like it would be if it was real. I still admiring your talent and your ideas. Thanks for sharing this kind of work, that’s super inspiring.